ReverseTrendLine
ReverseTrendLine builds support and resistance trendlines from recent highs
and lows, then trades rejection behavior around those lines rather than the
breakout path used by TrendLine.
Visual overview
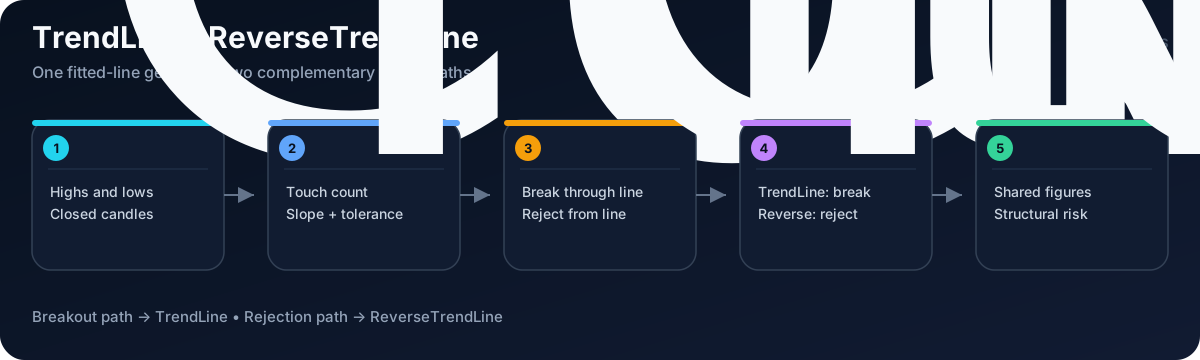
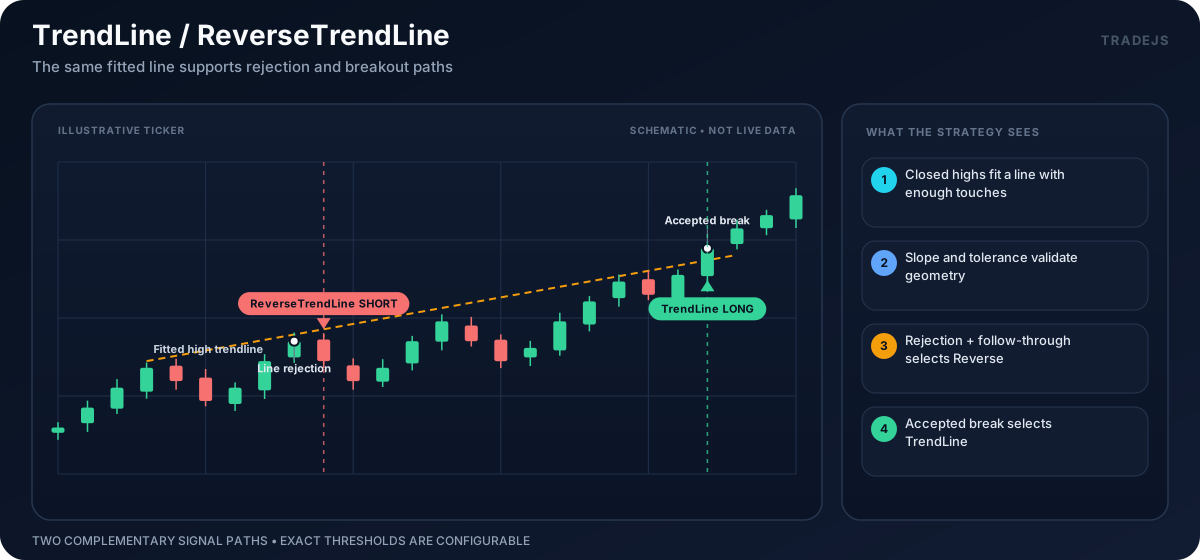
The illustrations are schematic, not market data. Exact thresholds, confirmation rules, and risk parameters come from the active strategy config.
Entry Logic
- Builds high and low trendline candidates from candle pivots.
- Skips until an enabled side (
HIGHSorLOWS) produces a valid reverse setup. - Applies volatility and timing filters.
- Selects the side config from the candidate direction.
- Places a stop from
REVERSE_TRENDLINE_STOP_BASE_PCT. - Computes target from
REVERSE_TRENDLINE_TARGET_R_MULT. - Sizes quantity from
MAX_LOSS_VALUE / riskDistance, using theRISK_FEE_RATE,RISK_SLIPPAGE_BPS, andRISK_MARKET_IMPACT_BPSestimates. - Returns
entrywith reverse-trendline figures and signal seed indicators.
Entry code:
REVERSE_TRENDLINE_SIGNAL
Exits
When a position exists:
REVERSE_TRENDLINE_FAILED_BOUNCE_EXITwhen the expected bounce/rejection fails.- otherwise
POSITION_EXISTS.
Configuration keys
Keys are grouped by the part of the strategy they control. A value of 0 or
false disables the corresponding optional filter unless stated otherwise.
| Group | Keys | Purpose |
|---|---|---|
| Runtime | ENV, INTERVAL, MAKE_ORDERS, CLOSE_OPPOSITE_POSITIONS, BACKTEST_PRICE_MODE | Select the runtime mode, candle interval, order behavior, and backtest fill price. |
| AI | AI_ENABLED, AI_MODE, MIN_AI_QUALITY | Control optional AI enrichment and its acceptance threshold. |
| Risk | RISK_FEE_RATE, RISK_SLIPPAGE_BPS, RISK_MARKET_IMPACT_BPS, MAX_LOSS_VALUE, REVERSE_TRENDLINE_STOP_BASE_PCT, REVERSE_TRENDLINE_TARGET_R_MULT | Estimate one-way fees, slippage, and market impact, size positions, and set the stop distance and target R multiple. |
| Shared indicators | MA_FAST, MA_MEDIUM, MA_SLOW, OBV_SMA, ATR, ATR_PCT_SHORT, ATR_PCT_LONG, BB, BB_STD, MACD_FAST, MACD_SLOW, MACD_SIGNAL | Set the lookback periods used by the trendline context and signal filters. |
| Line geometry | TRENDLINE.minTouches, TRENDLINE.offset, TRENDLINE.epsilon, TRENDLINE.epsilonOffset | Define pivot spacing, required touches, and price tolerance for fitted lines. |
| Rejection quality | REVERSE_TRENDLINE_MIN_REJECTION_WICK_PCT, REVERSE_TRENDLINE_MIN_REJECTION_STRENGTH_PCT, REVERSE_TRENDLINE_MIN_REJECTION_STRENGTH_PCT_LONG, REVERSE_TRENDLINE_MIN_REJECTION_STRENGTH_PCT_SHORT, REVERSE_TRENDLINE_MAX_BREAK_ATR_RATIO, REVERSE_TRENDLINE_MAX_BREAK_ATR_RATIO_LONG, REVERSE_TRENDLINE_MAX_BREAK_ATR_RATIO_SHORT | Require a visible rejection and limit how far price may pass through the line, globally or by direction. |
| Market alignment | REVERSE_TRENDLINE_MAX_BTC_MA_SPREAD_PCT, REVERSE_TRENDLINE_MAX_BTC_MA_SPREAD_PCT_LONG, REVERSE_TRENDLINE_MAX_BTC_MA_SPREAD_PCT_SHORT, REVERSE_TRENDLINE_REQUIRE_COIN_BIAS_ALIGNMENT, REVERSE_TRENDLINE_REQUIRE_BTC_BIAS_ALIGNMENT | Limit BTC trend spread and optionally require coin and BTC bias to agree with the trade. |
| Entry and exit timing | REVERSE_TRENDLINE_ALLOWED_ENTRY_TIMINGS, REVERSE_TRENDLINE_FAILED_BOUNCE_EXIT_PCT | Choose accepted detector states and the adverse move that closes a failed bounce. |
| Direction policy | HIGHS.*, LOWS.* | Enable rejection from high or low trendlines and set its direction and minimum risk/reward ratio. |
Signal Payload
The strategy stores:
- reverse-trendline figures from
buildReverseTrendLineFigures(...) - signal seed indicators from
buildReverseTrendlineSignalSeed(...) orderPlan.qtyorderPlan.stopLossPrice- one take-profit at the computed target
Common Skip Reasons
NO_TRENDLINEPOSITION_EXISTSDEV_TRADE_COOLDOWNVERY_VOLATILITYREVERSE_TRENDLINE_TIMING:<code>INVALID_QTYRISK_RATIO:<value>
Validation Notes
Trendline strategies are sensitive to pivot selection, candle gaps, and chart scaling. Inspect generated figures before interpreting metrics, especially when changing TRENDLINE.epsilon or timeframe.
Related: